Candlestick Chart
A chart where each candle shows the open, high, low, and close for one period: the body spans open to close and the wicks mark the extremes. Color shows whether price closed up or down.
A daily candle that opens at $100, reaches $106 and $98, and closes at $104 is green, with a body from $100 to $104.
The go-to chart. Open, high, low and close in one candle.
Each candle shows where the price opened, how far it moved, and where it ended up.
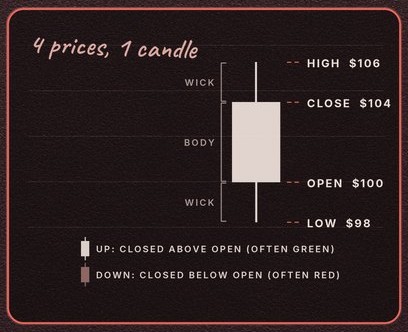
A chart of open, high, low and close.
All 4 slides, still.
Tap a slide to open it full size. Save it, share it, study it.
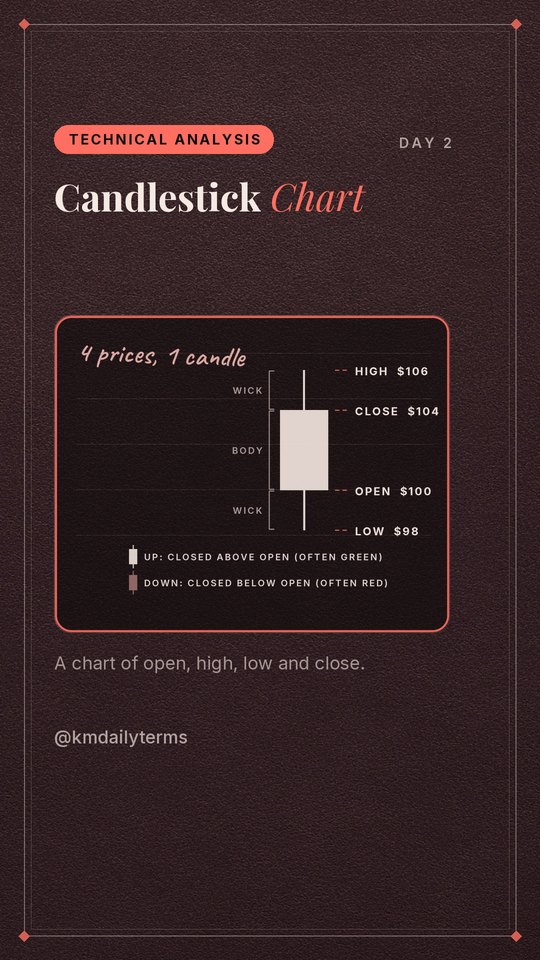
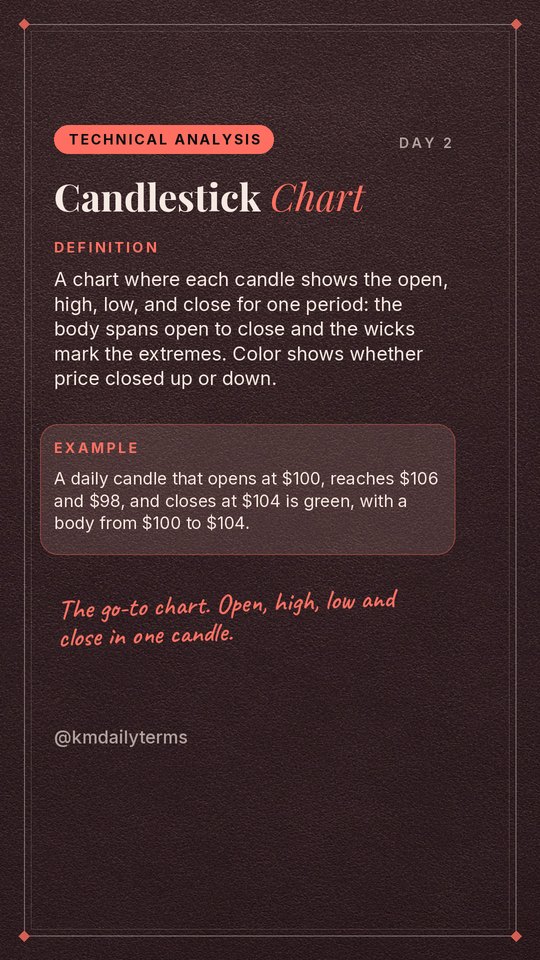
Chart Patterns Pack
This term is part of our printable Chart Patterns Pack: every slide and chart in one tidy PDF.
Japanese Candlestick Charting Techniques
by Steve Nison
[Placeholder: your one-line take on why this book helps with Candlestick Chart.]
View on AmazonAffiliate link: we may earn a small commission at no cost to you. DisclosureLearn one term a day, by email.
Sign up and we’ll send you a one-page 30 candlestick patterns cheat sheet, then a calm weekly recap of that week’s 7 terms. No hype, unsubscribe anytime.