Bear Market
A long stretch when prices in a broad market are falling and pessimism is high. It is often defined as a drop of 20% or more from a recent high.
An index slides from 5,000 to 4,000 over nine months, a 20% decline from its peak, which officially counts as a bear market.
The flip side of Day 1. A long, broad slide, not one bad week.
When everything is going down and no one feels good.
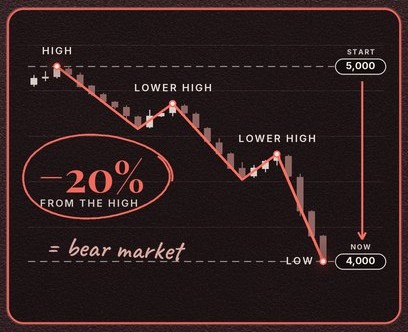
A market in a long, broad downtrend.
All 4 slides, still.
Tap a slide to open it full size. Save it, share it, study it.
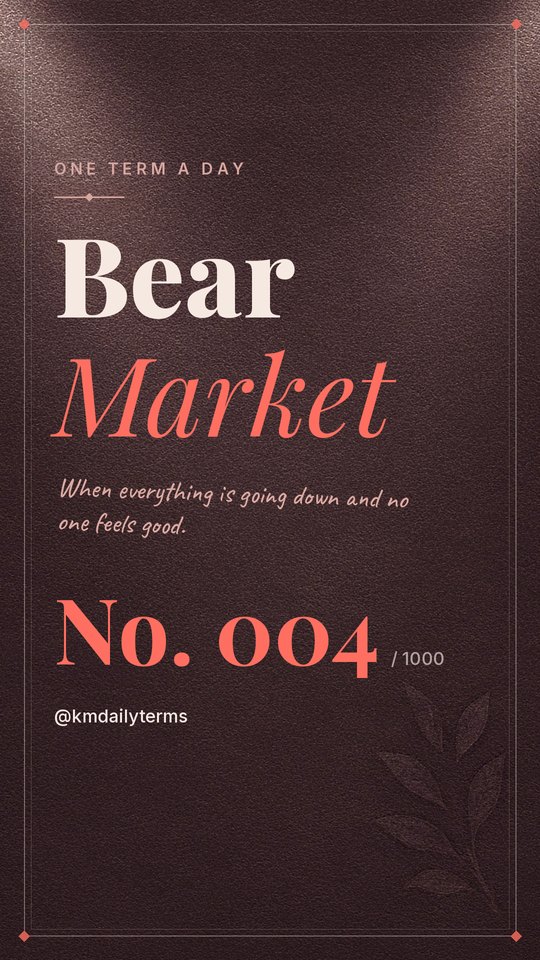
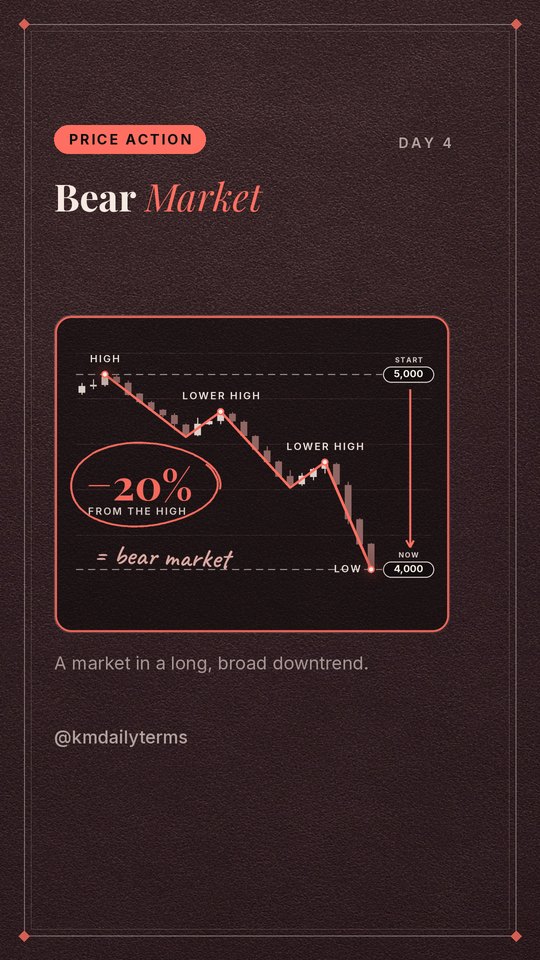
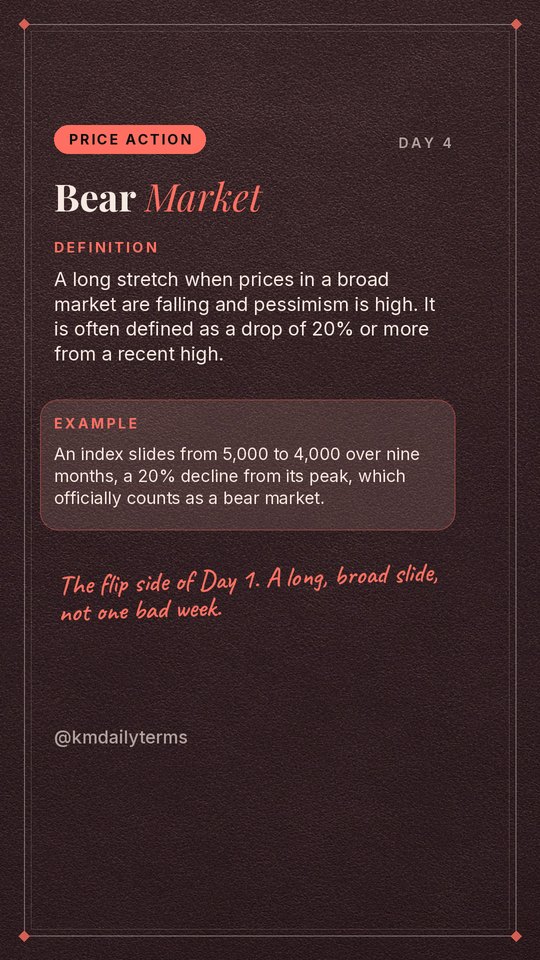

Chart Patterns Pack
This term is part of our printable Chart Patterns Pack: every slide and chart in one tidy PDF.
A Random Walk Down Wall Street
by Burton G. Malkiel
[Placeholder: your one-line take on why this book helps with Bear Market.]
View on AmazonAffiliate link: we may earn a small commission at no cost to you. DisclosureLearn one term a day, by email.
Sign up and we’ll send you a one-page 30 candlestick patterns cheat sheet, then a calm weekly recap of that week’s 7 terms. No hype, unsubscribe anytime.